
Hi guys, We have a small test installation here running around 30 vms on 2 hosts. oVirt 4.2.5.3 The hosts each have 512 GB memory, and the vms are sized with 4-8 GB each. I have noticed that over the last months, the memory usage in the dashboard has been increasing and is now showing 946.8 GB used of 1007.2 GB. What can be causing this? TIA, -- -- Tony Albers Systems Architect Systems Director, National Cultural Heritage Cluster Royal Danish Library, Victor Albecks Vej 1, 8000 Aarhus C, Denmark. Tel: +45 2566 2383 / +45 8946 2316

Grab a shell on your hosts and check top memory use quick. Could be VDSMD, in which case restarting the process will give you a temp fix. If you’re running hyperconvered, check your gluster version, there was a leak in versions 3.12.7 - 3.1.12 or so, updating ovirt/gluster is the best fix for that.
On Dec 10, 2018, at 7:36 AM, Tony Brian Albers <tba@kb.dk> wrote:
Hi guys,
We have a small test installation here running around 30 vms on 2 hosts.
oVirt 4.2.5.3
The hosts each have 512 GB memory, and the vms are sized with 4-8 GB each.
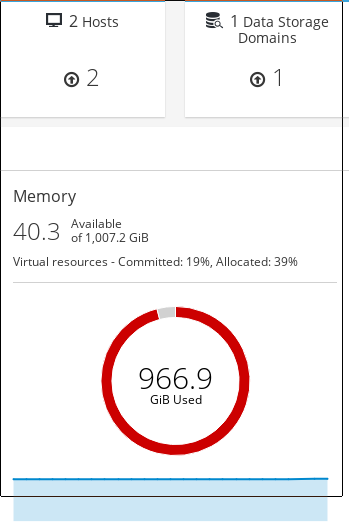
I have noticed that over the last months, the memory usage in the dashboard has been increasing and is now showing 946.8 GB used of 1007.2 GB.
What can be causing this?
TIA,
-- -- Tony Albers Systems Architect Systems Director, National Cultural Heritage Cluster Royal Danish Library, Victor Albecks Vej 1, 8000 Aarhus C, Denmark. Tel: +45 2566 2383 / +45 8946 2316 _______________________________________________ Users mailing list -- users@ovirt.org To unsubscribe send an email to users-leave@ovirt.org Privacy Statement: https://www.ovirt.org/site/privacy-policy/ oVirt Code of Conduct: https://www.ovirt.org/community/about/community-guidelines/ List Archives: https://lists.ovirt.org/archives/list/users@ovirt.org/message/SDDH2OC5RBOVYY...
Looks ok to me: top - 08:38:07 up 103 days, 22:05, 1 user, load average: 0.68, 0.62, 0.57 Tasks: 565 total, 1 running, 564 sleeping, 0 stopped, 0 zombie %Cpu(s): 1.0 us, 0.5 sy, 0.0 ni, 98.5 id, 0.0 wa, 0.0 hi, 0.0 si, 0.0 st KiB Mem : 52807689+total, 22355988 free, 10132873+used, 40439219+buff/cache KiB Swap: 4194300 total, 4193780 free, 520 used. 42492028+avail Mem PID USER PR NI VIRT RES SHR S %CPU %MEM TIME+ COMMAND 14187 qemu 20 0 9144668 8.1g 14072 S 12.6 1.6 6506:46 qemu-kvm 11153 qemu 20 0 9244680 8.1g 13700 S 4.3 1.6 18881:11 qemu-kvm 12436 qemu 20 0 9292936 8.1g 13712 S 3.3 1.6 21071:56 qemu-kvm 5517 qemu 20 0 9128268 8.1g 14084 S 3.0 1.6 5801:03 qemu-kvm 11764 qemu 20 0 9185364 8.1g 13720 S 3.0 1.6 10585:14 qemu-kvm 7938 qemu 20 0 9252876 8.1g 13744 S 2.6 1.6 21912:46 qemu-kvm 12791 qemu 20 0 9182292 8.1g 14140 S 2.6 1.6 17299:36 qemu-kvm 4602 vdsm 0 -20 4803160 114132 13860 S 2.3 0.0 2123:45 vdsmd 7621 qemu 20 0 9187424 4.8g 14264 S 2.3 1.0 3114:25 qemu-kvm 12066 qemu 20 0 9188436 8.1g 13708 S 2.3 1.6 10629:53 qemu-kvm 135526 qemu 20 0 9298060 8.1g 13664 S 2.0 1.6 5792:05 qemu-kvm 6587 qemu 20 0 4883036 4.1g 13744 S 1.3 0.8 2334:54 qemu-kvm 3814 root 20 0 1450200 25096 14208 S 1.0 0.0 368:03.80 libvirtd 6902 qemu 20 0 9110480 8.0g 13580 S 1.0 1.6 1787:57 qemu-kvm 7249 qemu 20 0 4913084 1.6g 13712 S 0.7 0.3 1367:32 qemu-kvm It looks like it's only in oVirt-engine that there's an issue. The host seems happy enough. /tony On Mon, 2018-12-10 at 20:14 -0600, Darrell Budic wrote:
Grab a shell on your hosts and check top memory use quick. Could be VDSMD, in which case restarting the process will give you a temp fix. If you’re running hyperconvered, check your gluster version, there was a leak in versions 3.12.7 - 3.1.12 or so, updating ovirt/gluster is the best fix for that.
On Dec 10, 2018, at 7:36 AM, Tony Brian Albers <tba@kb.dk> wrote:
Hi guys,
We have a small test installation here running around 30 vms on 2 hosts.
oVirt 4.2.5.3
The hosts each have 512 GB memory, and the vms are sized with 4-8 GB each.
I have noticed that over the last months, the memory usage in the dashboard has been increasing and is now showing 946.8 GB used of 1007.2 GB.
What can be causing this?
TIA,
-- -- Tony Albers Systems Architect Systems Director, National Cultural Heritage Cluster Royal Danish Library, Victor Albecks Vej 1, 8000 Aarhus C, Denmark. Tel: +45 2566 2383 / +45 8946 2316 _______________________________________________ Users mailing list -- users@ovirt.org To unsubscribe send an email to users-leave@ovirt.org Privacy Statement: https://www.ovirt.org/site/privacy-policy/ oVirt Code of Conduct: https://www.ovirt.org/community/about/commun ity-guidelines/ List Archives: https://lists.ovirt.org/archives/list/users@ovirt.or g/message/SDDH2OC5RBOVYYCLGPOUF6HO676HWI5U/
-- Tony Albers Systems Architect Systems Director, National Cultural Heritage Cluster Royal Danish Library, Victor Albecks Vej 1, 8000 Aarhus C, Denmark. Tel: +45 2566 2383 / +45 8946 2316
That’s only reporting 42G available of your 512, ok but something still using it. Try sorting the top by memory %, should be ‘>’ while it’s running.
On Dec 11, 2018, at 1:39 AM, Tony Brian Albers <tba@kb.dk> wrote:
Looks ok to me:
top - 08:38:07 up 103 days, 22:05, 1 user, load average: 0.68, 0.62, 0.57 Tasks: 565 total, 1 running, 564 sleeping, 0 stopped, 0 zombie %Cpu(s): 1.0 us, 0.5 sy, 0.0 ni, 98.5 id, 0.0 wa, 0.0 hi, 0.0 si, 0.0 st KiB Mem : 52807689+total, 22355988 free, 10132873+used, 40439219+buff/cache KiB Swap: 4194300 total, 4193780 free, 520 used. 42492028+avail Mem
PID USER PR NI VIRT RES SHR S %CPU %MEM TIME+ COMMAND 14187 qemu 20 0 9144668 8.1g 14072 S 12.6 1.6 6506:46 qemu-kvm 11153 qemu 20 0 9244680 8.1g 13700 S 4.3 1.6 18881:11 qemu-kvm 12436 qemu 20 0 9292936 8.1g 13712 S 3.3 1.6 21071:56 qemu-kvm 5517 qemu 20 0 9128268 8.1g 14084 S 3.0 1.6 5801:03 qemu-kvm 11764 qemu 20 0 9185364 8.1g 13720 S 3.0 1.6 10585:14 qemu-kvm 7938 qemu 20 0 9252876 8.1g 13744 S 2.6 1.6 21912:46 qemu-kvm 12791 qemu 20 0 9182292 8.1g 14140 S 2.6 1.6 17299:36 qemu-kvm 4602 vdsm 0 -20 4803160 <tel:20%204803160> 114132 13860 S 2.3 0.0 2123:45 vdsmd 7621 qemu 20 0 9187424 4.8g 14264 S 2.3 1.0 3114:25 qemu-kvm 12066 qemu 20 0 9188436 8.1g 13708 S 2.3 1.6 10629:53 qemu-kvm 135526 qemu 20 0 9298060 8.1g 13664 S 2.0 1.6 5792:05 qemu-kvm 6587 qemu 20 0 4883036 4.1g 13744 S 1.3 0.8 2334:54 qemu-kvm 3814 root 20 0 1450200 <tel:1450200> 25096 14208 S 1.0 0.0 368:03.80 libvirtd 6902 qemu 20 0 9110480 8.0g 13580 S 1.0 1.6 1787:57 qemu-kvm 7249 qemu 20 0 4913084 1.6g 13712 S 0.7 0.3 1367:32 qemu-kvm
It looks like it's only in oVirt-engine that there's an issue. The host seems happy enough.
/tony
On Mon, 2018-12-10 at 20:14 -0600, Darrell Budic wrote:
Grab a shell on your hosts and check top memory use quick. Could be VDSMD, in which case restarting the process will give you a temp fix. If you’re running hyperconvered, check your gluster version, there was a leak in versions 3.12.7 - 3.1.12 or so, updating ovirt/gluster is the best fix for that.
On Dec 10, 2018, at 7:36 AM, Tony Brian Albers <tba@kb.dk> wrote:
Hi guys,
We have a small test installation here running around 30 vms on 2 hosts.
oVirt 4.2.5.3
The hosts each have 512 GB memory, and the vms are sized with 4-8 GB each.
I have noticed that over the last months, the memory usage in the dashboard has been increasing and is now showing 946.8 GB used of 1007.2 GB.
What can be causing this?
TIA,
-- -- Tony Albers Systems Architect Systems Director, National Cultural Heritage Cluster Royal Danish Library, Victor Albecks Vej 1, 8000 Aarhus C, Denmark. Tel: +45 2566 2383 / +45 8946 2316 _______________________________________________ Users mailing list -- users@ovirt.org To unsubscribe send an email to users-leave@ovirt.org Privacy Statement: https://www.ovirt.org/site/privacy-policy/ oVirt Code of Conduct: https://www.ovirt.org/community/about/commun ity-guidelines/ List Archives: https://lists.ovirt.org/archives/list/users@ovirt.or g/message/SDDH2OC5RBOVYYCLGPOUF6HO676HWI5U/
-- Tony Albers Systems Architect Systems Director, National Cultural Heritage Cluster Royal Danish Library, Victor Albecks Vej 1, 8000 Aarhus C, Denmark. Tel: +45 2566 2383 <tel:+45%202566%202383> / +45 8946 2316 <tel:+45%208946%202316>
I'm not following you on the 42G available, the way I see it there's 400+G available: [root@man-001 ~]# free -h total used free shared buff/cache a vailable Mem: 503G 96G 19G 205M 387G 405G Swap: 4.0G 520K 4.0G And here's top sorted by %mem usage: top - 07:29:00 up 104 days, 20:56, 1 user, load average: 0.59, 0.68, 0.67 Tasks: 564 total, 1 running, 563 sleeping, 0 stopped, 0 zombie %Cpu(s): 1.5 us, 0.2 sy, 0.0 ni, 98.2 id, 0.0 wa, 0.0 hi, 0.0 si, 0.0 st KiB Mem : 52807689+total, 20085144 free, 10132981+used, 40666195+buff/cache KiB Swap: 4194300 total, 4193780 free, 520 used. 42491062+avail Mem PID USER PR NI VIRT RES SHR S %CPU %MEM TIME+ COMMAND 5517 qemu 20 0 9128268 8.1g 14084 S 3.0 1.6 5892:07 qemu-kvm 14187 qemu 20 0 9210236 8.1g 14072 S 5.3 1.6 6586:00 qemu-kvm 12791 qemu 20 0 9272448 8.1g 14140 S 14.2 1.6 17452:10 qemu-kvm 135526 qemu 20 0 9117748 8.1g 13664 S 2.3 1.6 5874:48 qemu-kvm 7938 qemu 20 0 9129936 8.1g 13744 S 2.3 1.6 22109:28 qemu-kvm 11764 qemu 20 0 9275520 8.1g 13720 S 3.3 1.6 10679:25 qemu-kvm 12066 qemu 20 0 9360552 8.1g 13708 S 3.0 1.6 10724:34 qemu-kvm 11153 qemu 20 0 9113544 8.1g 13700 S 15.6 1.6 19050:12 qemu-kvm 12436 qemu 20 0 9161800 8.1g 13712 S 16.2 1.6 21268:00 qemu-kvm 6902 qemu 20 0 9110480 8.0g 13580 S 0.7 1.6 1804:16 qemu-kvm 7621 qemu 20 0 9203816 4.8g 14264 S 1.7 1.0 3143:35 qemu-kvm 6587 qemu 20 0 4880980 4.1g 13744 S 0.7 0.8 2354:56 qemu-kvm 7249 qemu 20 0 4913084 1.6g 13712 S 0.7 0.3 1380:38 qemu-kvm 111877 qemu 20 0 1911088 1.1g 14076 S 0.3 0.2 419:58.70 qemu-kvm 4602 vdsm 0 -20 4803160 114184 13860 S 1.3 0.0 2143:44 vdsmd 4058 root 15 -5 1154020 38804 9588 S 0.0 0.0 0:00.81 supervdsmd 818 root 20 0 84576 35356 34940 S 0.0 0.0 1:05.60 systemd-journal 3602 root 20 0 1496796 32536 9232 S 0.0 0.0 123:53.70 python 2672 root 20 0 358328 30228 7984 S 0.0 0.0 0:14.76 firewalld 4801 vdsm 20 0 1640996 28904 5484 S 0.0 0.0 1265:14 python Rebooting a host doesn't help, (I've tried that earlier) the only thing that works is to stop all vm's, reboot all hosts at the same time and start vm's again. Then memory usage shown in the dashboard slowly increases over time again. /tony On Tue, 2018-12-11 at 14:09 -0600, Darrell Budic wrote:
That’s only reporting 42G available of your 512, ok but something still using it. Try sorting the top by memory %, should be ‘>’ while it’s running.
On Dec 11, 2018, at 1:39 AM, Tony Brian Albers <tba@kb.dk> wrote:
Looks ok to me:
top - 08:38:07 up 103 days, 22:05, 1 user, load average: 0.68, 0.62, 0.57 Tasks: 565 total, 1 running, 564 sleeping, 0 stopped, 0 zombie %Cpu(s): 1.0 us, 0.5 sy, 0.0 ni, 98.5 id, 0.0 wa, 0.0 hi, 0.0 si, 0.0 st KiB Mem : 52807689+total, 22355988 free, 10132873+used, 40439219+buff/cache KiB Swap: 4194300 total, 4193780 free, 520 used. 42492028+avail Mem
PID USER PR NI VIRT RES SHR S %CPU %MEM TIME+ COMMAND 14187 qemu 20 0 9144668 8.1g 14072 S 12.6 1.6 6506:46 qemu-kvm 11153 qemu 20 0 9244680 8.1g 13700 S 4.3 1.6 18881:11 qemu-kvm 12436 qemu 20 0 9292936 8.1g 13712 S 3.3 1.6 21071:56 qemu-kvm 5517 qemu 20 0 9128268 8.1g 14084 S 3.0 1.6 5801:03 qemu-kvm 11764 qemu 20 0 9185364 8.1g 13720 S 3.0 1.6 10585:14 qemu-kvm 7938 qemu 20 0 9252876 8.1g 13744 S 2.6 1.6 21912:46 qemu-kvm 12791 qemu 20 0 9182292 8.1g 14140 S 2.6 1.6 17299:36 qemu-kvm 4602 vdsm 0 -20 4803160 <tel:20%204803160> 114132 13860 S 2.3 0.0 2123:45 vdsmd 7621 qemu 20 0 9187424 4.8g 14264 S 2.3 1.0 3114:25 qemu-kvm 12066 qemu 20 0 9188436 8.1g 13708 S 2.3 1.6 10629:53 qemu-kvm 135526 qemu 20 0 9298060 8.1g 13664 S 2.0 1.6 5792:05 qemu-kvm 6587 qemu 20 0 4883036 4.1g 13744 S 1.3 0.8 2334:54 qemu-kvm 3814 root 20 0 1450200 <tel:1450200> 25096 14208 S 1.0 0.0 368:03.80 libvirtd 6902 qemu 20 0 9110480 8.0g 13580 S 1.0 1.6 1787:57 qemu-kvm 7249 qemu 20 0 4913084 1.6g 13712 S 0.7 0.3 1367:32 qemu-kvm
It looks like it's only in oVirt-engine that there's an issue. The host seems happy enough.
/tony
On Mon, 2018-12-10 at 20:14 -0600, Darrell Budic wrote:
Grab a shell on your hosts and check top memory use quick. Could be VDSMD, in which case restarting the process will give you a temp fix. If you’re running hyperconvered, check your gluster version, there was a leak in versions 3.12.7 - 3.1.12 or so, updating ovirt/gluster is the best fix for that.
On Dec 10, 2018, at 7:36 AM, Tony Brian Albers <tba@kb.dk> wrote:
Hi guys,
We have a small test installation here running around 30 vms on 2 hosts.
oVirt 4.2.5.3
The hosts each have 512 GB memory, and the vms are sized with 4-8 GB each.
I have noticed that over the last months, the memory usage in the dashboard has been increasing and is now showing 946.8 GB used of 1007.2 GB.
What can be causing this?
TIA,
-- -- Tony Albers Systems Architect Systems Director, National Cultural Heritage Cluster Royal Danish Library, Victor Albecks Vej 1, 8000 Aarhus C, Denmark. Tel: +45 2566 2383 / +45 8946 2316 _______________________________________________ Users mailing list -- users@ovirt.org To unsubscribe send an email to users-leave@ovirt.org Privacy Statement: https://www.ovirt.org/site/privacy-policy/ oVirt Code of Conduct: https://www.ovirt.org/community/about/co mmun ity-guidelines/ List Archives: https://lists.ovirt.org/archives/list/users@ovir t.or g/message/SDDH2OC5RBOVYYCLGPOUF6HO676HWI5U/
-- Tony Albers Systems Architect Systems Director, National Cultural Heritage Cluster Royal Danish Library, Victor Albecks Vej 1, 8000 Aarhus C, Denmark. Tel: +45 2566 2383 <tel:+45%202566%202383> / +45 8946 2316 <tel:+45%208946%202316>
-- -- Tony Albers Systems Architect Systems Director, National Cultural Heritage Cluster Royal Danish Library, Victor Albecks Vej 1, 8000 Aarhus C, Denmark. Tel: +45 2566 2383 / +45 8946 2316
Yeah, you’re right about 400G, I dropped a digit reading it out of your top display. So what are you seeing in the dashboard, I’m not sure I understand the disconnect between the top you shared and what you’re seeing there. It shows lots more than 110G in use, I gather? Or are you seeing this on the hosts page per host mem use?
On Dec 12, 2018, at 12:34 AM, Tony Brian Albers <tba@kb.dk> wrote:
I'm not following you on the 42G available, the way I see it there's 400+G available:
[root@man-001 ~]# free -h total used free shared buff/cache a vailable Mem: 503G 96G 19G 205M 387G 405G Swap: 4.0G 520K 4.0G
And here's top sorted by %mem usage:
top - 07:29:00 up 104 days, 20:56, 1 user, load average: 0.59, 0.68, 0.67 Tasks: 564 total, 1 running, 563 sleeping, 0 stopped, 0 zombie %Cpu(s): 1.5 us, 0.2 sy, 0.0 ni, 98.2 id, 0.0 wa, 0.0 hi, 0.0 si, 0.0 st KiB Mem : 52807689+total, 20085144 free, 10132981+used, 40666195+buff/cache KiB Swap: 4194300 total, 4193780 free, 520 used. 42491062+avail Mem
PID USER PR NI VIRT RES SHR S %CPU %MEM TIME+ COMMAND 5517 qemu 20 0 9128268 8.1g 14084 S 3.0 1.6 5892:07 qemu-kvm 14187 qemu 20 0 9210236 8.1g 14072 S 5.3 1.6 6586:00 qemu-kvm 12791 qemu 20 0 9272448 8.1g 14140 S 14.2 1.6 17452:10 qemu-kvm 135526 qemu 20 0 9117748 8.1g 13664 S 2.3 1.6 5874:48 qemu-kvm 7938 qemu 20 0 9129936 8.1g 13744 S 2.3 1.6 22109:28 qemu-kvm 11764 qemu 20 0 9275520 8.1g 13720 S 3.3 1.6 10679:25 qemu-kvm 12066 qemu 20 0 9360552 8.1g 13708 S 3.0 1.6 10724:34 qemu-kvm 11153 qemu 20 0 9113544 8.1g 13700 S 15.6 1.6 19050:12 qemu-kvm 12436 qemu 20 0 9161800 8.1g 13712 S 16.2 1.6 21268:00 qemu-kvm 6902 qemu 20 0 9110480 8.0g 13580 S 0.7 1.6 1804:16 qemu-kvm 7621 qemu 20 0 9203816 4.8g 14264 S 1.7 1.0 3143:35 qemu-kvm 6587 qemu 20 0 4880980 4.1g 13744 S 0.7 0.8 2354:56 qemu-kvm 7249 qemu 20 0 4913084 1.6g 13712 S 0.7 0.3 1380:38 qemu-kvm 111877 qemu 20 0 1911088 <tel:1911088> 1.1g 14076 S 0.3 0.2 419:58.70 qemu-kvm 4602 vdsm 0 -20 4803160 <tel:20%204803160> 114184 13860 S 1.3 0.0 2143:44 vdsmd 4058 root 15 -5 1154020 <tel:1154020> 38804 9588 S 0.0 0.0 0:00.81 supervdsmd 818 root 20 0 84576 35356 34940 S 0.0 0.0 1:05.60 systemd-journal 3602 root 20 0 1496796 <tel:1496796> 32536 9232 S 0.0 0.0 123:53.70 python 2672 root 20 0 358328 30228 7984 S 0.0 0.0 0:14.76 firewalld 4801 vdsm 20 0 1640996 <tel:1640996> 28904 5484 S 0.0 0.0 1265:14 python
Rebooting a host doesn't help, (I've tried that earlier) the only thing that works is to stop all vm's, reboot all hosts at the same time and start vm's again. Then memory usage shown in the dashboard slowly increases over time again.
/tony
On Tue, 2018-12-11 at 14:09 -0600, Darrell Budic wrote:
That’s only reporting 42G available of your 512, ok but something still using it. Try sorting the top by memory %, should be ‘>’ while it’s running.
On Dec 11, 2018, at 1:39 AM, Tony Brian Albers <tba@kb.dk> wrote:
Looks ok to me:
top - 08:38:07 up 103 days, 22:05, 1 user, load average: 0.68, 0.62, 0.57 Tasks: 565 total, 1 running, 564 sleeping, 0 stopped, 0 zombie %Cpu(s): 1.0 us, 0.5 sy, 0.0 ni, 98.5 id, 0.0 wa, 0.0 hi, 0.0 si, 0.0 st KiB Mem : 52807689+total, 22355988 free, 10132873+used, 40439219+buff/cache KiB Swap: 4194300 total, 4193780 free, 520 used. 42492028+avail Mem
PID USER PR NI VIRT RES SHR S %CPU %MEM TIME+ COMMAND 14187 qemu 20 0 9144668 8.1g 14072 S 12.6 1.6 6506:46 qemu-kvm 11153 qemu 20 0 9244680 8.1g 13700 S 4.3 1.6 18881:11 qemu-kvm 12436 qemu 20 0 9292936 8.1g 13712 S 3.3 1.6 21071:56 qemu-kvm 5517 qemu 20 0 9128268 8.1g 14084 S 3.0 1.6 5801:03 qemu-kvm 11764 qemu 20 0 9185364 8.1g 13720 S 3.0 1.6 10585:14 qemu-kvm 7938 qemu 20 0 9252876 8.1g 13744 S 2.6 1.6 21912:46 qemu-kvm 12791 qemu 20 0 9182292 8.1g 14140 S 2.6 1.6 17299:36 qemu-kvm 4602 vdsm 0 -20 4803160 <tel:20%204803160> <tel:20%204803160 <tel:20%204803160>> 114132 13860 S 2.3 0.0 2123:45 vdsmd 7621 qemu 20 0 9187424 4.8g 14264 S 2.3 1.0 3114:25 qemu-kvm 12066 qemu 20 0 9188436 8.1g 13708 S 2.3 1.6 10629:53 qemu-kvm 135526 qemu 20 0 9298060 8.1g 13664 S 2.0 1.6 5792:05 qemu-kvm 6587 qemu 20 0 4883036 4.1g 13744 S 1.3 0.8 2334:54 qemu-kvm 3814 root 20 0 1450200 <tel:1450200> <tel:1450200 <tel:1450200>> 25096 14208 S 1.0 0.0 368:03.80 libvirtd 6902 qemu 20 0 9110480 8.0g 13580 S 1.0 1.6 1787:57 qemu-kvm 7249 qemu 20 0 4913084 1.6g 13712 S 0.7 0.3 1367:32 qemu-kvm
It looks like it's only in oVirt-engine that there's an issue. The host seems happy enough.
/tony
On Mon, 2018-12-10 at 20:14 -0600, Darrell Budic wrote:
Grab a shell on your hosts and check top memory use quick. Could be VDSMD, in which case restarting the process will give you a temp fix. If you’re running hyperconvered, check your gluster version, there was a leak in versions 3.12.7 - 3.1.12 or so, updating ovirt/gluster is the best fix for that.
On Dec 10, 2018, at 7:36 AM, Tony Brian Albers <tba@kb.dk> wrote:
Hi guys,
We have a small test installation here running around 30 vms on 2 hosts.
oVirt 4.2.5.3
The hosts each have 512 GB memory, and the vms are sized with 4-8 GB each.
I have noticed that over the last months, the memory usage in the dashboard has been increasing and is now showing 946.8 GB used of 1007.2 GB.
What can be causing this?
TIA,
-- -- Tony Albers Systems Architect Systems Director, National Cultural Heritage Cluster Royal Danish Library, Victor Albecks Vej 1, 8000 Aarhus C, Denmark. Tel: +45 2566 2383 / +45 8946 2316 _______________________________________________ Users mailing list -- users@ovirt.org To unsubscribe send an email to users-leave@ovirt.org Privacy Statement: https://www.ovirt.org/site/privacy-policy/ oVirt Code of Conduct: https://www.ovirt.org/community/about/co mmun ity-guidelines/ List Archives: https://lists.ovirt.org/archives/list/users@ovir t.or g/message/SDDH2OC5RBOVYYCLGPOUF6HO676HWI5U/
-- Tony Albers Systems Architect Systems Director, National Cultural Heritage Cluster Royal Danish Library, Victor Albecks Vej 1, 8000 Aarhus C, Denmark. Tel: +45 2566 2383 <tel:+45%202566%202383> <tel:+45%202566%202383 <tel:+45%202566%202383>> / +45 8946 2316 <tel:+45%208946%202316> <tel:+45%208946%202316 <tel:+45%208946%202316>>
-- -- Tony Albers Systems Architect Systems Director, National Cultural Heritage Cluster Royal Danish Library, Victor Albecks Vej 1, 8000 Aarhus C, Denmark. Tel: +45 2566 2383 <tel:+45%202566%202383> / +45 8946 2316 <tel:+45%208946%202316>
Screenshots attached We have 2 hosts and 24 running vms, all vms are pretty small. As you can see, top and the dashboard does not agree. An interesting thing is that if I view the host itself in the engine, it says under "General" that Max free Memory for scheduling new VMs: 413360 MB So maybe it's some sort of caching that's using the memory. /tony On Wed, 2018-12-12 at 09:59 -0600, Darrell Budic wrote:
Yeah, you’re right about 400G, I dropped a digit reading it out of your top display.
So what are you seeing in the dashboard, I’m not sure I understand the disconnect between the top you shared and what you’re seeing there. It shows lots more than 110G in use, I gather? Or are you seeing this on the hosts page per host mem use?
On Dec 12, 2018, at 12:34 AM, Tony Brian Albers <tba@kb.dk> wrote:
I'm not following you on the 42G available, the way I see it there's 400+G available:
[root@man-001 ~]# free -h total used free shared buff/cache a vailable Mem: 503G 96G 19G 205M 387G 405G Swap: 4.0G 520K 4.0G
And here's top sorted by %mem usage:
top - 07:29:00 up 104 days, 20:56, 1 user, load average: 0.59, 0.68, 0.67 Tasks: 564 total, 1 running, 563 sleeping, 0 stopped, 0 zombie %Cpu(s): 1.5 us, 0.2 sy, 0.0 ni, 98.2 id, 0.0 wa, 0.0 hi, 0.0 si, 0.0 st KiB Mem : 52807689+total, 20085144 free, 10132981+used, 40666195+buff/cache KiB Swap: 4194300 total, 4193780 free, 520 used. 42491062+avail Mem
PID USER PR NI VIRT RES SHR S %CPU %MEM TIME+ COMMAND 5517 qemu 20 0 9128268 8.1g 14084 S 3.0 1.6 5892:07 qemu-kvm 14187 qemu 20 0 9210236 8.1g 14072 S 5.3 1.6 6586:00 qemu-kvm 12791 qemu 20 0 9272448 8.1g 14140 S 14.2 1.6 17452:10 qemu-kvm 135526 qemu 20 0 9117748 8.1g 13664 S 2.3 1.6 5874:48 qemu-kvm 7938 qemu 20 0 9129936 8.1g 13744 S 2.3 1.6 22109:28 qemu-kvm 11764 qemu 20 0 9275520 8.1g 13720 S 3.3 1.6 10679:25 qemu-kvm 12066 qemu 20 0 9360552 8.1g 13708 S 3.0 1.6 10724:34 qemu-kvm 11153 qemu 20 0 9113544 8.1g 13700 S 15.6 1.6 19050:12 qemu-kvm 12436 qemu 20 0 9161800 8.1g 13712 S 16.2 1.6 21268:00 qemu-kvm 6902 qemu 20 0 9110480 8.0g 13580 S 0.7 1.6 1804:16 qemu-kvm 7621 qemu 20 0 9203816 4.8g 14264 S 1.7 1.0 3143:35 qemu-kvm 6587 qemu 20 0 4880980 4.1g 13744 S 0.7 0.8 2354:56 qemu-kvm 7249 qemu 20 0 4913084 1.6g 13712 S 0.7 0.3 1380:38 qemu-kvm 111877 qemu 20 0 1911088 1.1g 14076 S 0.3 0.2 419:58.70 qemu-kvm 4602 vdsm 0 -20 4803160 114184 13860 S 1.3 0.0 2143:44 vdsmd 4058 root 15 -5 1154020 38804 9588 S 0.0 0.0 0:00.81 supervdsmd 818 root 20 0 84576 35356 34940 S 0.0 0.0 1:05.60 systemd-journal 3602 root 20 0 1496796 32536 9232 S 0.0 0.0 123:53.70 python 2672 root 20 0 358328 30228 7984 S 0.0 0.0 0:14.76 firewalld 4801 vdsm 20 0 1640996 28904 5484 S 0.0 0.0 1265:14 python
Rebooting a host doesn't help, (I've tried that earlier) the only thing that works is to stop all vm's, reboot all hosts at the same time and start vm's again. Then memory usage shown in the dashboard slowly increases over time again.
/tony
On Tue, 2018-12-11 at 14:09 -0600, Darrell Budic wrote:
That’s only reporting 42G available of your 512, ok but something still using it. Try sorting the top by memory %, should be ‘>’ while it’s running.
On Dec 11, 2018, at 1:39 AM, Tony Brian Albers <tba@kb.dk> wrote:
Looks ok to me:
top - 08:38:07 up 103 days, 22:05, 1 user, load average: 0.68, 0.62, 0.57 Tasks: 565 total, 1 running, 564 sleeping, 0 stopped, 0 zombie %Cpu(s): 1.0 us, 0.5 sy, 0.0 ni, 98.5 id, 0.0 wa, 0.0 hi, 0.0 si, 0.0 st KiB Mem : 52807689+total, 22355988 free, 10132873+used, 40439219+buff/cache KiB Swap: 4194300 total, 4193780 free, 520 used. 42492028+avail Mem
PID USER PR NI VIRT RES SHR S %CPU %MEM TIME+ COMMAND 14187 qemu 20 0 9144668 8.1g 14072 S 12.6 1.6 6506:46 qemu-kvm 11153 qemu 20 0 9244680 8.1g 13700 S 4.3 1.6 18881:11 qemu-kvm 12436 qemu 20 0 9292936 8.1g 13712 S 3.3 1.6 21071:56 qemu-kvm 5517 qemu 20 0 9128268 8.1g 14084 S 3.0 1.6 5801:03 qemu-kvm 11764 qemu 20 0 9185364 8.1g 13720 S 3.0 1.6 10585:14 qemu-kvm 7938 qemu 20 0 9252876 8.1g 13744 S 2.6 1.6 21912:46 qemu-kvm 12791 qemu 20 0 9182292 8.1g 14140 S 2.6 1.6 17299:36 qemu-kvm 4602 vdsm 0 -20 4803160 <tel:20%204803160> 114132 13860 S 2.3 0.0 2123:45 vdsmd 7621 qemu 20 0 9187424 4.8g 14264 S 2.3 1.0 3114:25 qemu-kvm 12066 qemu 20 0 9188436 8.1g 13708 S 2.3 1.6 10629:53 qemu-kvm 135526 qemu 20 0 9298060 8.1g 13664 S 2.0 1.6 5792:05 qemu-kvm 6587 qemu 20 0 4883036 4.1g 13744 S 1.3 0.8 2334:54 qemu-kvm 3814 root 20 0 1450200 <tel:1450200> 25096 14208 S 1.0 0.0 368:03.80 libvirtd 6902 qemu 20 0 9110480 8.0g 13580 S 1.0 1.6 1787:57 qemu-kvm 7249 qemu 20 0 4913084 1.6g 13712 S 0.7 0.3 1367:32 qemu-kvm
It looks like it's only in oVirt-engine that there's an issue. The host seems happy enough.
/tony
On Mon, 2018-12-10 at 20:14 -0600, Darrell Budic wrote:
Grab a shell on your hosts and check top memory use quick. Could be VDSMD, in which case restarting the process will give you a temp fix. If you’re running hyperconvered, check your gluster version, there was a leak in versions 3.12.7 - 3.1.12 or so, updating ovirt/gluster is the best fix for that.
On Dec 10, 2018, at 7:36 AM, Tony Brian Albers <tba@kb.dk> wrote:
Hi guys,
We have a small test installation here running around 30 vms on 2 hosts.
oVirt 4.2.5.3
The hosts each have 512 GB memory, and the vms are sized with 4-8 GB each.
I have noticed that over the last months, the memory usage in the dashboard has been increasing and is now showing 946.8 GB used of 1007.2 GB.
What can be causing this?
TIA,
-- -- Tony Albers Systems Architect Systems Director, National Cultural Heritage Cluster Royal Danish Library, Victor Albecks Vej 1, 8000 Aarhus C, Denmark. Tel: +45 2566 2383 / +45 8946 2316 _______________________________________________ Users mailing list -- users@ovirt.org To unsubscribe send an email to users-leave@ovirt.org Privacy Statement: https://www.ovirt.org/site/privacy-polic y/ oVirt Code of Conduct: https://www.ovirt.org/community/abou t/co mmun ity-guidelines/ List Archives: https://lists.ovirt.org/archives/list/users@ ovir t.or g/message/SDDH2OC5RBOVYYCLGPOUF6HO676HWI5U/
-- Tony Albers Systems Architect Systems Director, National Cultural Heritage Cluster Royal Danish Library, Victor Albecks Vej 1, 8000 Aarhus C, Denmark. Tel: +45 2566 2383 <tel:+45%202566%202383> / +45 8946 2316 <tel:+45%208946%202316>
-- -- Tony Albers Systems Architect Systems Director, National Cultural Heritage Cluster Royal Danish Library, Victor Albecks Vej 1, 8000 Aarhus C, Denmark. Tel: +45 2566 2383 / +45 8946 2316
-- Tony Albers Systems Architect Systems Director, National Cultural Heritage Cluster Royal Danish Library, Victor Albecks Vej 1, 8000 Aarhus C, Denmark. Tel: +45 2566 2383 / +45 8946 2316
Agree, looks like disk caching, which is considered in use but can be freed as things ask for it. What kind of storage are you using here? I checked my converged group, the GUI memory use looks like it includes the cache as well, just not as extreme as yours :) If you wanted to confirm, you could clear it with sync; echo 3 > /proc/sys/vm/drop_caches and you should get all the cache memory back without rebooting. Presumably, it’s all holding filesystem data for quick access, so not a terrible thing, just alarming to see 97% utilization. Unless it kicked off unneeded MOM runs if you’re using same page merging and ballooning, then its doing unneeded work and maybe slowing your VMs… You’d probably see it in top if this was the case, it’s fairly CPU intensive. Ultimately, you may want to file a bug/feature request to have the GUI differentiate cache from “regular’ in use memory for clarity.
On Dec 13, 2018, at 12:06 AM, Tony Brian Albers <tba@kb.dk> wrote:
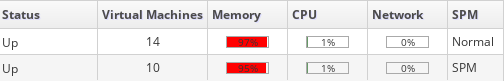
Screenshots attached
We have 2 hosts and 24 running vms, all vms are pretty small.
As you can see, top and the dashboard does not agree.
An interesting thing is that if I view the host itself in the engine, it says under "General" that Max free Memory for scheduling new VMs: 413360 MB
So maybe it's some sort of caching that's using the memory.
/tony
On Wed, 2018-12-12 at 09:59 -0600, Darrell Budic wrote:
Yeah, you’re right about 400G, I dropped a digit reading it out of your top display.
So what are you seeing in the dashboard, I’m not sure I understand the disconnect between the top you shared and what you’re seeing there. It shows lots more than 110G in use, I gather? Or are you seeing this on the hosts page per host mem use?
On Dec 12, 2018, at 12:34 AM, Tony Brian Albers <tba@kb.dk> wrote:
I'm not following you on the 42G available, the way I see it there's 400+G available:
[root@man-001 ~]# free -h total used free shared buff/cache a vailable Mem: 503G 96G 19G 205M 387G
405G Swap: 4.0G 520K 4.0G
And here's top sorted by %mem usage:
top - 07:29:00 up 104 days, 20:56, 1 user, load average: 0.59, 0.68, 0.67 Tasks: 564 total, 1 running, 563 sleeping, 0 stopped, 0 zombie %Cpu(s): 1.5 us, 0.2 sy, 0.0 ni, 98.2 id, 0.0 wa, 0.0 hi, 0.0 si, 0.0 st KiB Mem : 52807689+total, 20085144 free, 10132981+used, 40666195+buff/cache KiB Swap: 4194300 total, 4193780 free, 520 used. 42491062+avail Mem
PID USER PR NI VIRT RES SHR S %CPU %MEM TIME+ COMMAND 5517 qemu 20 0 9128268 8.1g 14084 S 3.0 1.6 5892:07 qemu-kvm 14187 qemu 20 0 9210236 8.1g 14072 S 5.3 1.6 6586:00 qemu-kvm 12791 qemu 20 0 9272448 8.1g 14140 S 14.2 1.6 17452:10 qemu-kvm 135526 qemu 20 0 9117748 8.1g 13664 S 2.3 1.6 5874:48 qemu-kvm 7938 qemu 20 0 9129936 8.1g 13744 S 2.3 1.6 22109:28 qemu-kvm 11764 qemu 20 0 9275520 8.1g 13720 S 3.3 1.6 10679:25 qemu-kvm 12066 qemu 20 0 9360552 8.1g 13708 S 3.0 1.6 10724:34 qemu-kvm 11153 qemu 20 0 9113544 8.1g 13700 S 15.6 1.6 19050:12 qemu-kvm 12436 qemu 20 0 9161800 8.1g 13712 S 16.2 1.6 21268:00 qemu-kvm 6902 qemu 20 0 9110480 8.0g 13580 S 0.7 1.6 1804:16 qemu-kvm 7621 qemu 20 0 9203816 4.8g 14264 S 1.7 1.0 3143:35 qemu-kvm 6587 qemu 20 0 4880980 4.1g 13744 S 0.7 0.8 2354:56 qemu-kvm 7249 qemu 20 0 4913084 1.6g 13712 S 0.7 0.3 1380:38 qemu-kvm 111877 qemu 20 0 1911088 1.1g 14076 S 0.3 0.2 419:58.70 qemu-kvm 4602 vdsm 0 -20 4803160 114184 13860 S 1.3 0.0 2143:44 vdsmd 4058 root 15 -5 1154020 38804 9588 S 0.0 0.0 0:00.81 supervdsmd 818 root 20 0 84576 35356 34940 S 0.0 0.0 1:05.60 systemd-journal 3602 root 20 0 1496796 32536 9232 S 0.0 0.0 123:53.70 python 2672 root 20 0 358328 30228 7984 S 0.0 0.0 0:14.76 firewalld 4801 vdsm 20 0 1640996 28904 5484 S 0.0 0.0 1265:14 python
Rebooting a host doesn't help, (I've tried that earlier) the only thing that works is to stop all vm's, reboot all hosts at the same time and start vm's again. Then memory usage shown in the dashboard slowly increases over time again.
/tony
On Tue, 2018-12-11 at 14:09 -0600, Darrell Budic wrote:
That’s only reporting 42G available of your 512, ok but something still using it. Try sorting the top by memory %, should be ‘>’ while it’s running.
On Dec 11, 2018, at 1:39 AM, Tony Brian Albers <tba@kb.dk> wrote:
Looks ok to me:
top - 08:38:07 up 103 days, 22:05, 1 user, load average: 0.68, 0.62, 0.57 Tasks: 565 total, 1 running, 564 sleeping, 0 stopped, 0 zombie %Cpu(s): 1.0 us, 0.5 sy, 0.0 ni, 98.5 id, 0.0 wa, 0.0 hi, 0.0 si, 0.0 st KiB Mem : 52807689+total, 22355988 free, 10132873+used, 40439219+buff/cache KiB Swap: 4194300 total, 4193780 free, 520 used. 42492028+avail Mem
PID USER PR NI VIRT RES SHR S %CPU %MEM TIME+ COMMAND 14187 qemu 20 0 9144668 8.1g 14072 S 12.6 1.6 6506:46 qemu-kvm 11153 qemu 20 0 9244680 8.1g 13700 S 4.3 1.6 18881:11 qemu-kvm 12436 qemu 20 0 9292936 8.1g 13712 S 3.3 1.6 21071:56 qemu-kvm 5517 qemu 20 0 9128268 8.1g 14084 S 3.0 1.6 5801:03 qemu-kvm 11764 qemu 20 0 9185364 8.1g 13720 S 3.0 1.6 10585:14 qemu-kvm 7938 qemu 20 0 9252876 8.1g 13744 S 2.6 1.6 21912:46 qemu-kvm 12791 qemu 20 0 9182292 8.1g 14140 S 2.6 1.6 17299:36 qemu-kvm 4602 vdsm 0 -20 4803160 <tel:20%204803160> 114132 13860 S 2.3 0.0 2123:45 vdsmd 7621 qemu 20 0 9187424 4.8g 14264 S 2.3 1.0 3114:25 qemu-kvm 12066 qemu 20 0 9188436 8.1g 13708 S 2.3 1.6 10629:53 qemu-kvm 135526 qemu 20 0 9298060 8.1g 13664 S 2.0 1.6 5792:05 qemu-kvm 6587 qemu 20 0 4883036 4.1g 13744 S 1.3 0.8 2334:54 qemu-kvm 3814 root 20 0 1450200 <tel:1450200> 25096 14208 S 1.0 0.0 368:03.80 libvirtd 6902 qemu 20 0 9110480 8.0g 13580 S 1.0 1.6 1787:57 qemu-kvm 7249 qemu 20 0 4913084 1.6g 13712 S 0.7 0.3 1367:32 qemu-kvm
It looks like it's only in oVirt-engine that there's an issue. The host seems happy enough.
/tony
On Mon, 2018-12-10 at 20:14 -0600, Darrell Budic wrote:
Grab a shell on your hosts and check top memory use quick. Could be VDSMD, in which case restarting the process will give you a temp fix. If you’re running hyperconvered, check your gluster version, there was a leak in versions 3.12.7 - 3.1.12 or so, updating ovirt/gluster is the best fix for that.
> On Dec 10, 2018, at 7:36 AM, Tony Brian Albers <tba@kb.dk> > wrote: > > Hi guys, > > We have a small test installation here running around 30 > vms on > 2 > hosts. > > oVirt 4.2.5.3 > > The hosts each have 512 GB memory, and the vms are sized > with > 4-8 > GB > each. > > I have noticed that over the last months, the memory usage > in > the > dashboard has been increasing and is now showing 946.8 GB > used > of > 1007.2 GB. > > What can be causing this? > > TIA, > > -- > -- > Tony Albers > Systems Architect > Systems Director, National Cultural Heritage Cluster > Royal Danish Library, Victor Albecks Vej 1, 8000 Aarhus C, > Denmark. > Tel: +45 2566 2383 / +45 8946 2316 > _______________________________________________ > Users mailing list -- users@ovirt.org > To unsubscribe send an email to users-leave@ovirt.org > Privacy Statement: https://www.ovirt.org/site/privacy-polic > y/ > oVirt Code of Conduct: https://www.ovirt.org/community/abou > t/co > mmun > ity-guidelines/ > List Archives: https://lists.ovirt.org/archives/list/users@ > ovir > t.or > g/message/SDDH2OC5RBOVYYCLGPOUF6HO676HWI5U/
-- Tony Albers Systems Architect Systems Director, National Cultural Heritage Cluster Royal Danish Library, Victor Albecks Vej 1, 8000 Aarhus C, Denmark. Tel: +45 2566 2383 <tel:+45%202566%202383> / +45 8946 2316 <tel:+45%208946%202316>
-- -- Tony Albers Systems Architect Systems Director, National Cultural Heritage Cluster Royal Danish Library, Victor Albecks Vej 1, 8000 Aarhus C, Denmark. Tel: +45 2566 2383 / +45 8946 2316
-- Tony Albers Systems Architect Systems Director, National Cultural Heritage Cluster Royal Danish Library, Victor Albecks Vej 1, 8000 Aarhus C, Denmark. Tel: +45 2566 2383 <tel:+45%202566%202383> / +45 8946 2316 <tel:+45%208946%202316><2018-12-13-070032_349x526_scrot.png><2018-12-13-070259_504x81_scrot.png>
Yup, doing the 3 > drop_cache is clearly freeing up the memory. I've filed bug 1659342 in rh bugzilla Thanks Darrell, have a nice weekend. /tony On Thu, 2018-12-13 at 10:54 -0600, Darrell Budic wrote:
Agree, looks like disk caching, which is considered in use but can be freed as things ask for it. What kind of storage are you using here?
I checked my converged group, the GUI memory use looks like it includes the cache as well, just not as extreme as yours :) If you wanted to confirm, you could clear it with
sync; echo 3 > /proc/sys/vm/drop_caches
and you should get all the cache memory back without rebooting. Presumably, it’s all holding filesystem data for quick access, so not a terrible thing, just alarming to see 97% utilization. Unless it kicked off unneeded MOM runs if you’re using same page merging and ballooning, then its doing unneeded work and maybe slowing your VMs… You’d probably see it in top if this was the case, it’s fairly CPU intensive.
Ultimately, you may want to file a bug/feature request to have the GUI differentiate cache from “regular’ in use memory for clarity.
On Dec 13, 2018, at 12:06 AM, Tony Brian Albers <tba@kb.dk> wrote:
Screenshots attached
We have 2 hosts and 24 running vms, all vms are pretty small.
As you can see, top and the dashboard does not agree.
An interesting thing is that if I view the host itself in the engine, it says under "General" that Max free Memory for scheduling new VMs: 413360 MB
So maybe it's some sort of caching that's using the memory.
/tony
On Wed, 2018-12-12 at 09:59 -0600, Darrell Budic wrote:
Yeah, you’re right about 400G, I dropped a digit reading it out of your top display.
So what are you seeing in the dashboard, I’m not sure I understand the disconnect between the top you shared and what you’re seeing there. It shows lots more than 110G in use, I gather? Or are you seeing this on the hosts page per host mem use?
On Dec 12, 2018, at 12:34 AM, Tony Brian Albers <tba@kb.dk> wrote:
I'm not following you on the 42G available, the way I see it there's 400+G available:
[root@man-001 ~]# free -h total used free shared buff/c ache a vailable Mem: 503G 96G 19G 205M 387G 405G Swap: 4.0G 520K 4.0G
And here's top sorted by %mem usage:
top - 07:29:00 up 104 days, 20:56, 1 user, load average: 0.59, 0.68, 0.67 Tasks: 564 total, 1 running, 563 sleeping, 0 stopped, 0 zombie %Cpu(s): 1.5 us, 0.2 sy, 0.0 ni, 98.2 id, 0.0 wa, 0.0 hi, 0.0 si, 0.0 st KiB Mem : 52807689+total, 20085144 free, 10132981+used, 40666195+buff/cache KiB Swap: 4194300 total, 4193780 free, 520 used. 42491062+avail Mem
PID USER PR NI VIRT RES SHR S %CPU %MEM TIME+ COMMAND 5517 qemu 20 0 9128268 8.1g 14084 S 3.0 1.6 5892:07 qemu-kvm 14187 qemu 20 0 9210236 8.1g 14072 S 5.3 1.6 6586:00 qemu-kvm 12791 qemu 20 0 9272448 8.1g 14140 S 14.2 1.6 17452:10 qemu-kvm 135526 qemu 20 0 9117748 8.1g 13664 S 2.3 1.6 5874:48 qemu-kvm 7938 qemu 20 0 9129936 8.1g 13744 S 2.3 1.6 22109:28 qemu-kvm 11764 qemu 20 0 9275520 8.1g 13720 S 3.3 1.6 10679:25 qemu-kvm 12066 qemu 20 0 9360552 8.1g 13708 S 3.0 1.6 10724:34 qemu-kvm 11153 qemu 20 0 9113544 8.1g 13700 S 15.6 1.6 19050:12 qemu-kvm 12436 qemu 20 0 9161800 8.1g 13712 S 16.2 1.6 21268:00 qemu-kvm 6902 qemu 20 0 9110480 8.0g 13580 S 0.7 1.6 1804:16 qemu-kvm 7621 qemu 20 0 9203816 4.8g 14264 S 1.7 1.0 3143:35 qemu-kvm 6587 qemu 20 0 4880980 4.1g 13744 S 0.7 0.8 2354:56 qemu-kvm 7249 qemu 20 0 4913084 1.6g 13712 S 0.7 0.3 1380:38 qemu-kvm 111877 qemu 20 0 1911088 1.1g 14076 S 0.3 0.2 419:58.70 qemu-kvm 4602 vdsm 0 -20 4803160 114184 13860 S 1.3 0.0 2143:44 vdsmd 4058 root 15 -5 1154020 38804 9588 S 0.0 0.0 0:00.81 supervdsmd 818 root 20 0 84576 35356 34940 S 0.0 0.0 1:05.60 systemd-journal 3602 root 20 0 1496796 32536 9232 S 0.0 0.0 123:53.70 python 2672 root 20 0 358328 30228 7984 S 0.0 0.0 0:14.76 firewalld 4801 vdsm 20 0 1640996 28904 5484 S 0.0 0.0 1265:14 python
Rebooting a host doesn't help, (I've tried that earlier) the only thing that works is to stop all vm's, reboot all hosts at the same time and start vm's again. Then memory usage shown in the dashboard slowly increases over time again.
/tony
On Tue, 2018-12-11 at 14:09 -0600, Darrell Budic wrote:
That’s only reporting 42G available of your 512, ok but something still using it. Try sorting the top by memory %, should be ‘>’ while it’s running.
On Dec 11, 2018, at 1:39 AM, Tony Brian Albers <tba@kb.dk> wrote:
Looks ok to me:
top - 08:38:07 up 103 days, 22:05, 1 user, load average: 0.68, 0.62, 0.57 Tasks: 565 total, 1 running, 564 sleeping, 0 stopped, 0 zombie %Cpu(s): 1.0 us, 0.5 sy, 0.0 ni, 98.5 id, 0.0 wa, 0.0 hi, 0.0 si, 0.0 st KiB Mem : 52807689+total, 22355988 free, 10132873+used, 40439219+buff/cache KiB Swap: 4194300 total, 4193780 free, 520 used. 42492028+avail Mem
PID USER PR NI VIRT RES SHR S %CPU %MEM TIME+ COMMAND 14187 qemu 20 0 9144668 8.1g 14072 S 12.6 1.6 6506:46 qemu-kvm 11153 qemu 20 0 9244680 8.1g 13700 S 4.3 1.6 18881:11 qemu-kvm 12436 qemu 20 0 9292936 8.1g 13712 S 3.3 1.6 21071:56 qemu-kvm 5517 qemu 20 0 9128268 8.1g 14084 S 3.0 1.6 5801:03 qemu-kvm 11764 qemu 20 0 9185364 8.1g 13720 S 3.0 1.6 10585:14 qemu-kvm 7938 qemu 20 0 9252876 8.1g 13744 S 2.6 1.6 21912:46 qemu-kvm 12791 qemu 20 0 9182292 8.1g 14140 S 2.6 1.6 17299:36 qemu-kvm 4602 vdsm 0 -20 4803160 <tel:20%204803160> 114132 13860 S 2.3 0.0 2123:45 vdsmd 7621 qemu 20 0 9187424 4.8g 14264 S 2.3 1.0 3114:25 qemu-kvm 12066 qemu 20 0 9188436 8.1g 13708 S 2.3 1.6 10629:53 qemu-kvm 135526 qemu 20 0 9298060 8.1g 13664 S 2.0 1.6 5792:05 qemu-kvm 6587 qemu 20 0 4883036 4.1g 13744 S 1.3 0.8 2334:54 qemu-kvm 3814 root 20 0 1450200 <tel:1450200> 25096 14208 S 1.0 0.0 368:03.80 libvirtd 6902 qemu 20 0 9110480 8.0g 13580 S 1.0 1.6 1787:57 qemu-kvm 7249 qemu 20 0 4913084 1.6g 13712 S 0.7 0.3 1367:32 qemu-kvm
It looks like it's only in oVirt-engine that there's an issue. The host seems happy enough.
/tony
On Mon, 2018-12-10 at 20:14 -0600, Darrell Budic wrote: > Grab a shell on your hosts and check top memory use > quick. > Could > be > VDSMD, in which case restarting the process will give you > a > temp > fix. > If you’re running hyperconvered, check your gluster > version, > there > was a leak in versions 3.12.7 - 3.1.12 or so, updating > ovirt/gluster > is the best fix for that. > > > On Dec 10, 2018, at 7:36 AM, Tony Brian Albers <tba@kb. > > dk> > > wrote: > > > > Hi guys, > > > > We have a small test installation here running around > > 30 > > vms on > > 2 > > hosts. > > > > oVirt 4.2.5.3 > > > > The hosts each have 512 GB memory, and the vms are > > sized > > with > > 4-8 > > GB > > each. > > > > I have noticed that over the last months, the memory > > usage > > in > > the > > dashboard has been increasing and is now showing 946.8 > > GB > > used > > of > > 1007.2 GB. > > > > What can be causing this? > > > > TIA, > > > > -- > > -- > > Tony Albers > > Systems Architect > > Systems Director, National Cultural Heritage Cluster > > Royal Danish Library, Victor Albecks Vej 1, 8000 Aarhus > > C, > > Denmark. > > Tel: +45 2566 2383 / +45 8946 2316 > > _______________________________________________ > > Users mailing list -- users@ovirt.org > > To unsubscribe send an email to users-leave@ovirt.org > > Privacy Statement: https://www.ovirt.org/site/privacy-p > > olic > > y/ > > oVirt Code of Conduct: https://www.ovirt.org/community/ > > abou > > t/co > > mmun > > ity-guidelines/ > > List Archives: https://lists.ovirt.org/archives/list/us > > ers@ > > ovir > > t.or > > g/message/SDDH2OC5RBOVYYCLGPOUF6HO676HWI5U/
-- Tony Albers Systems Architect Systems Director, National Cultural Heritage Cluster Royal Danish Library, Victor Albecks Vej 1, 8000 Aarhus C, Denmark. Tel: +45 2566 2383 <tel:+45%202566%202383> / +45 8946 2316 <tel:+45%208946%202316>
-- -- Tony Albers Systems Architect Systems Director, National Cultural Heritage Cluster Royal Danish Library, Victor Albecks Vej 1, 8000 Aarhus C, Denmark. Tel: +45 2566 2383 / +45 8946 2316
-- Tony Albers Systems Architect Systems Director, National Cultural Heritage Cluster Royal Danish Library, Victor Albecks Vej 1, 8000 Aarhus C, Denmark. Tel: +45 2566 2383 <tel:+45%202566%202383> / +45 8946 2316 <tel:+45%208946%202316><2018-12-13-070032_349x526_scrot.png><2018- 12-13-070259_504x81_scrot.png>
-- -- Tony Albers Systems Architect Systems Director, National Cultural Heritage Cluster Royal Danish Library, Victor Albecks Vej 1, 8000 Aarhus C, Denmark. Tel: +45 2566 2383 / +45 8946 2316
participants (2)
-
 Darrell Budic
 -
 Tony Brian Albers