
No clue on why this is happening but I'd like to highlight that Windows 7 entered its End of Life on Tuesday, January 14, 2020 according to https://docs.microsoft.com/en-us/lifecycle/products/windows-7 . I would recommend using supported OSs within guests. Il giorno lun 6 giu 2022 alle ore 11:53 lizhijian@fujitsu.com < lizhijian@fujitsu.com> ha scritto:
Hi folks,
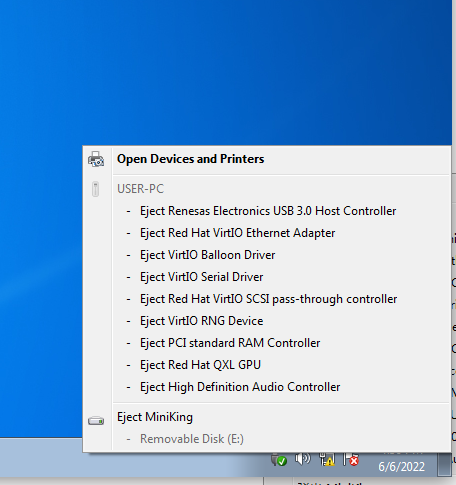
It's observed that win7 guest will become no response if i eject usb storage "Eject MiniKing"
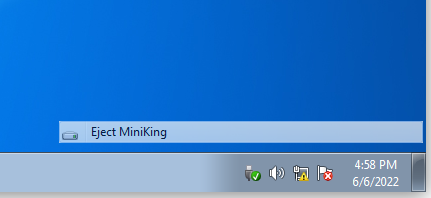
the last screen after i clicked "Eject MingKing":
After that, i have to hard reset the guest.
Thanks Zhijian _______________________________________________ Users mailing list -- users@ovirt.org To unsubscribe send an email to users-leave@ovirt.org Privacy Statement: https://www.ovirt.org/privacy-policy.html oVirt Code of Conduct: https://www.ovirt.org/community/about/community-guidelines/ List Archives: https://lists.ovirt.org/archives/list/users@ovirt.org/message/ILTHKI6CC7EJQS...
-- Sandro Bonazzola MANAGER, SOFTWARE ENGINEERING, EMEA R&D RHV Red Hat EMEA <https://www.redhat.com/> sbonazzo@redhat.com <https://www.redhat.com/> *Red Hat respects your work life balance. Therefore there is no need to answer this email out of your office hours.*